
With the recent Winter ’18 release of Sugar, SugarCRM introduced a significant enhancement to reporting tools in the form of drill through capability on charts.
The drill through feature gives the end user the ability to easily see the data that lies within the makeup up of the chart to provide further insight.
How does it work?
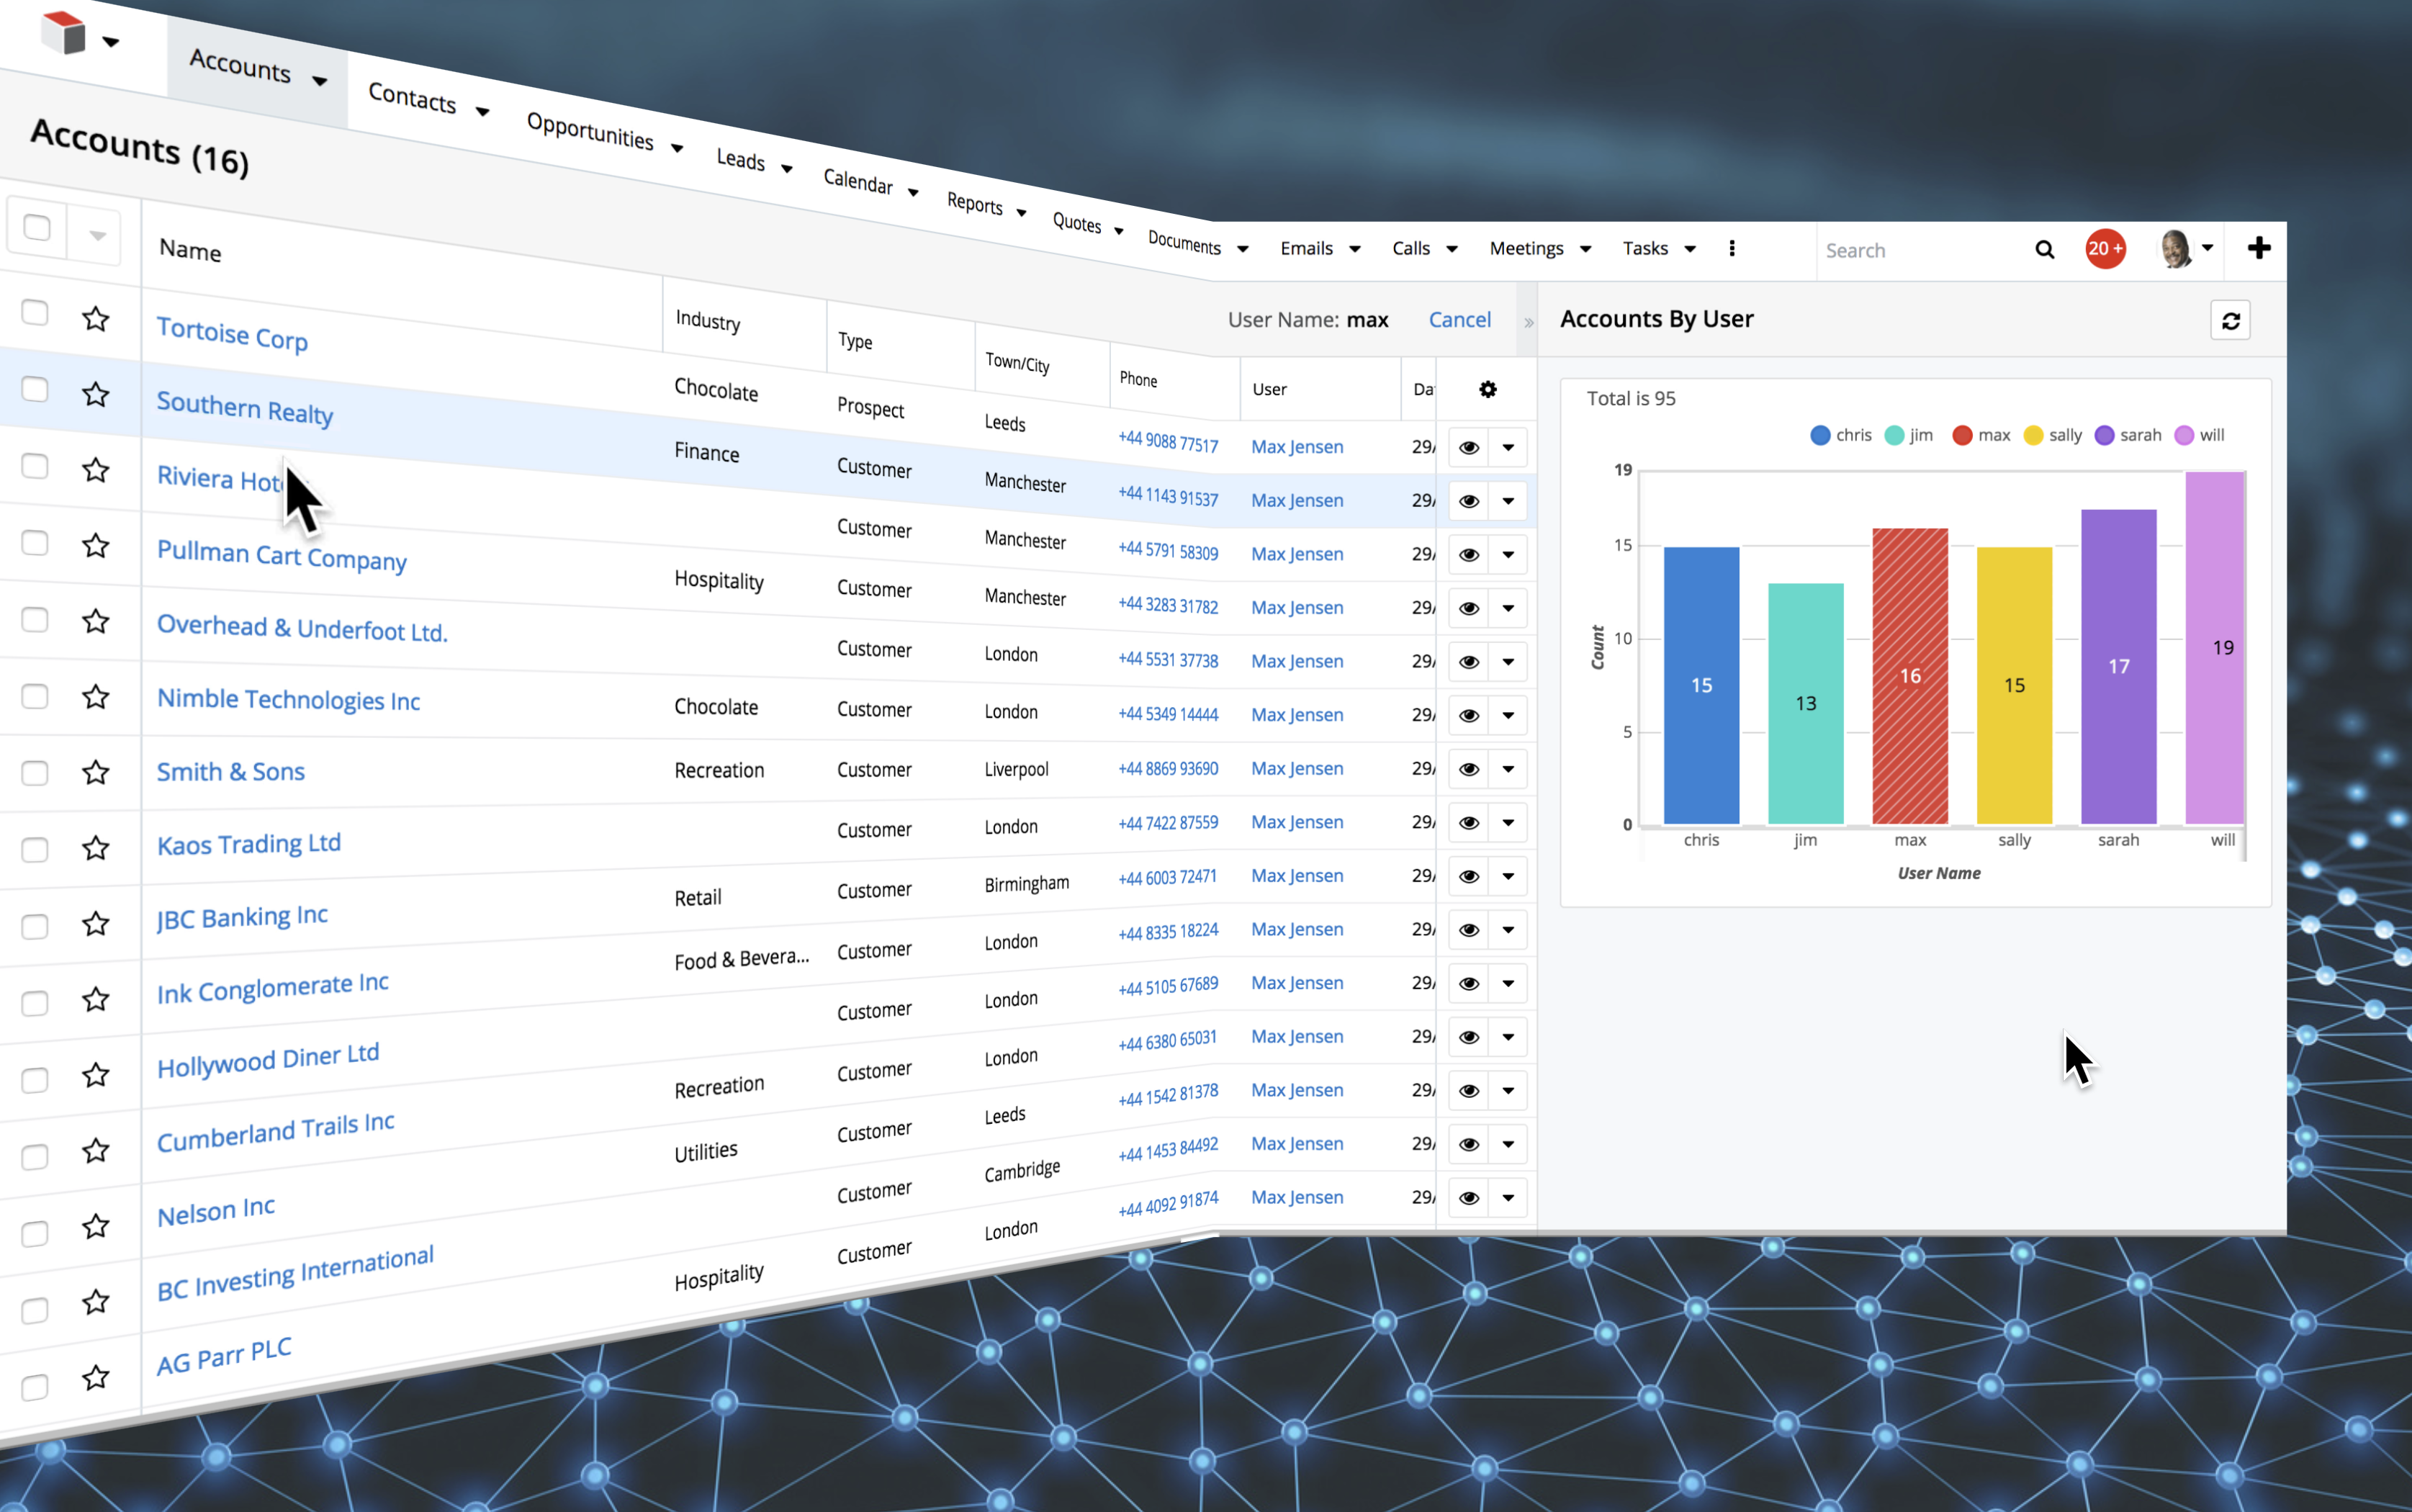
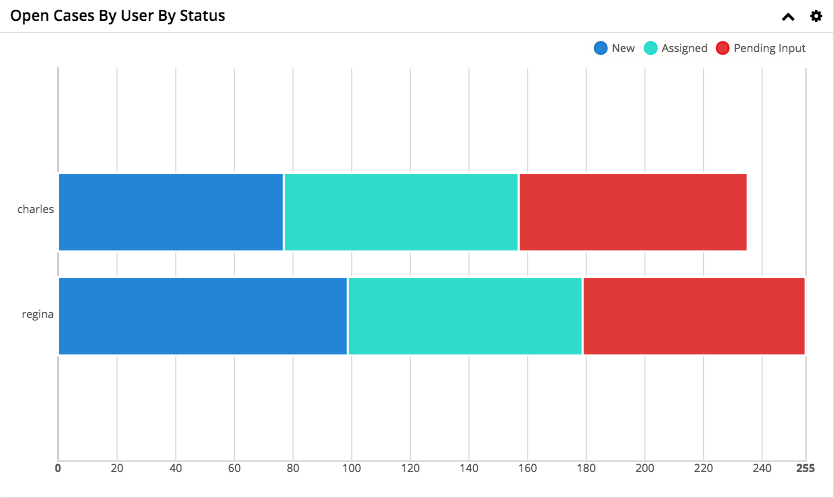
In order to see the data that is behind a chart you simply need to click on the relevant section of the chart which will then open up detailed data in a split screen List View. For example, in a chart that shows all Cases that have an ‘Open’ Status grouped by user:
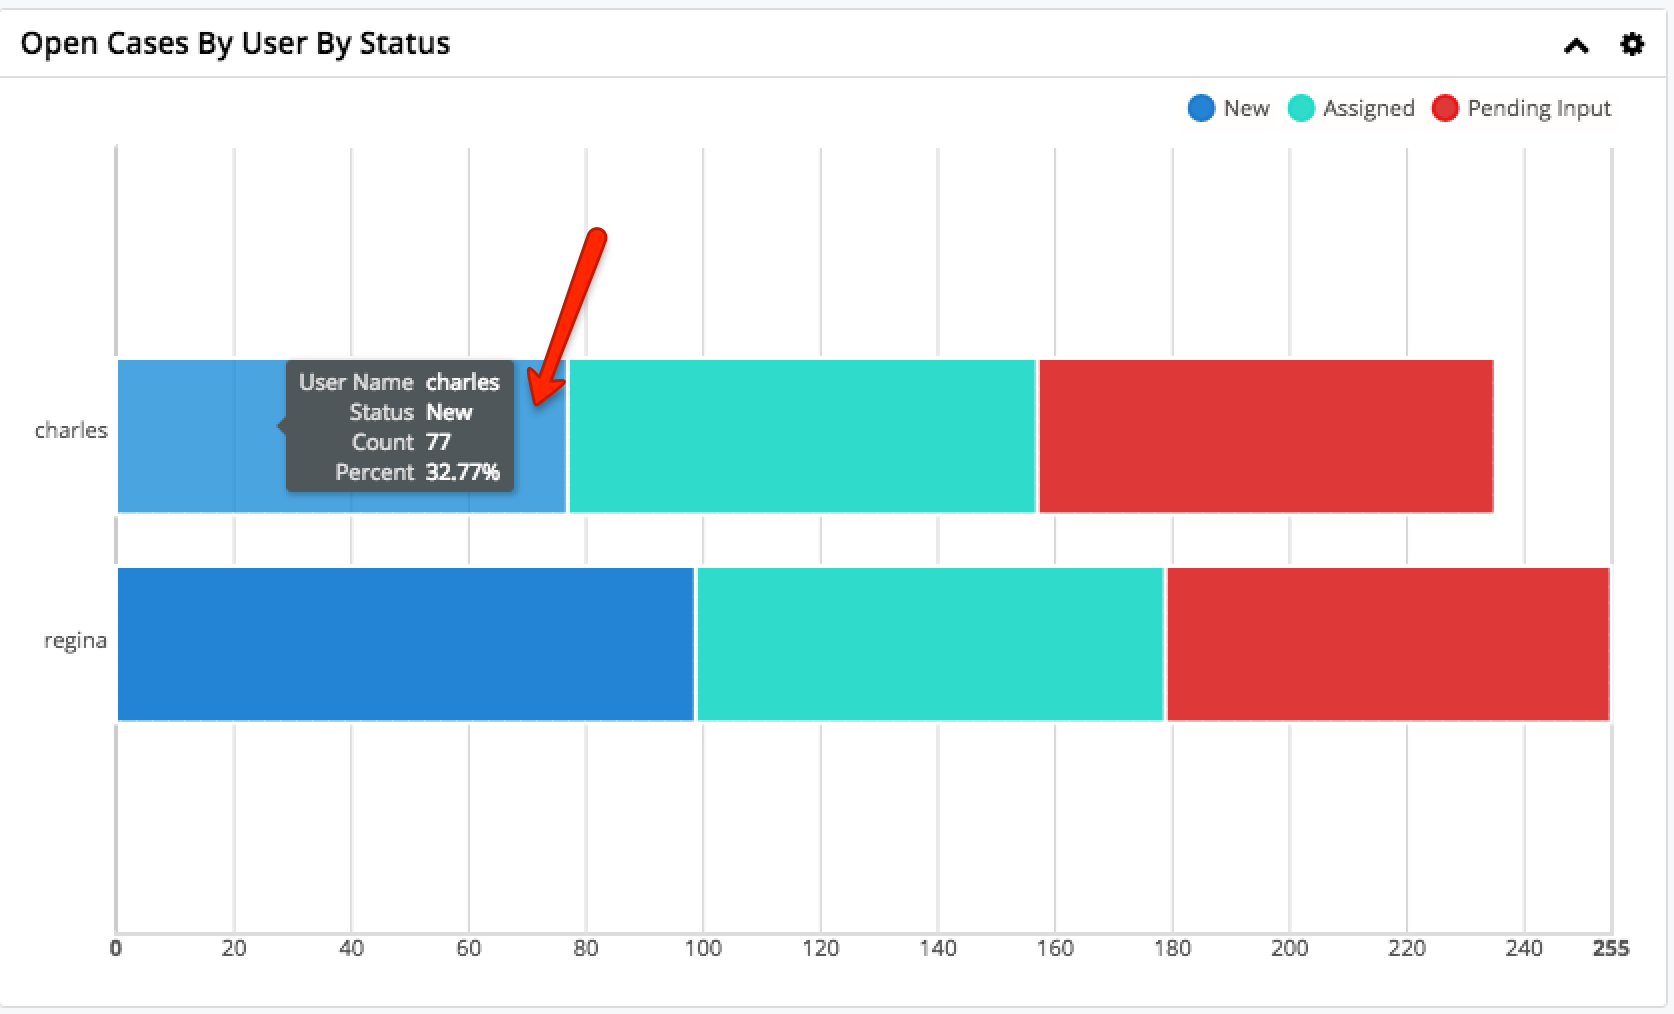
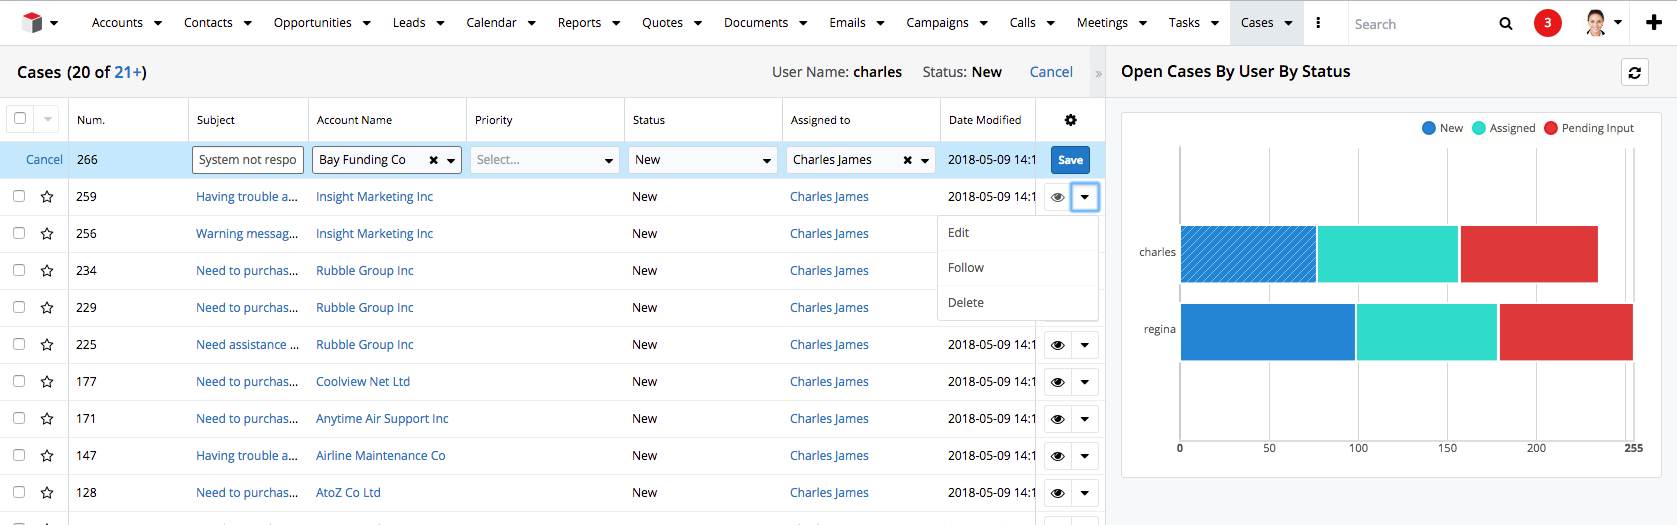
If you would like further details on all of the ‘New’ Cases assigned to ‘Charles’ then you can click on that section of the chart:
This will then open up a detailed view of all Cases that make up that section with the report chart still being displayed to the right of the screen, highlighting the section that is being displayed in detail:
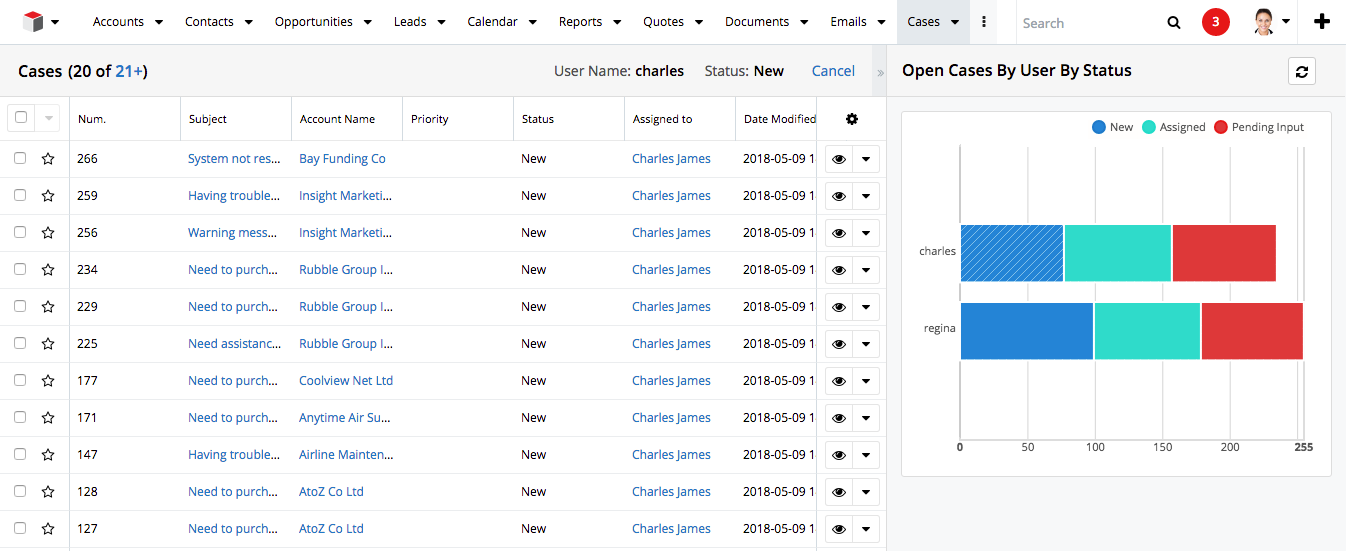
If you would like to review the details of another Status/User section, you can click on a different section in the chart on the right-hand side without having to navigate back to the original report/dashlet.
In addition to being able to see details from the report chart, you are also able to take action on the records. You can either use the clickable links to navigate to the Record View or you can use the actions dropdown to perform inline editing without having to navigate away from the drill through view. This works in the same way as List View allowing you to edit, delete or perform mass actions to the records.
This drill through feature allows you to significantly improve the ease in which records are managed.
If you have any further questions about the drill through charts functionality, please contact us using the button below.

 Update – Release Notes")